
What Does the Average New Female Lifetime Mortgage Customer Look Like?

To mark International Women’s Day and its 2025 theme of ‘Accelerate Action’ regarding gender equality, we wanted to share our data to widen understanding of what a modern, single life applicant woman looks like within the equity release space. In 2024, 67% of our single life applicants were women, up from 64% in 2023.
Property trends
Property trends among our customers have remained remarkably stable year-on-year, and analysis found that 38% of new business among single women in 2024 came from owners of properties valued at between £250,000 and £399,000, with another 15% coming from owners of homes valued at between £400,000 and £549,000. Additionally, 3% of business among female single life applicants came from owners of £1m+ properties.
This compared to 32% of male single applicants being owners of properties valued between £250,000 and £399,000, and 14% coming from owners of homes valued at between £400,000 and £549,000. 4% of new single male customers, meanwhile, were owners of £1m+ properties.
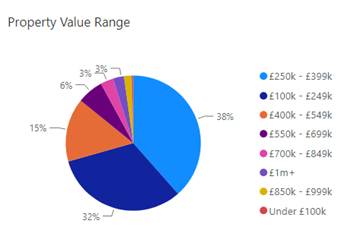
2024 property value breakdown for new single female lifetime mortgage customers
How has this changed over time?
Looking at the data we pulled as part of our research report, The Evolving Lifetime Mortgage Customer: An exploration of changing equity release demographics, which examined emerging trends between 2019 and 2024, we noticed two key trends.
Firstly, among single women the proportion of new plans coming from those in properties valued at between £100,000 and £250,000 reduced significantly from the 47% seen in 2019.
At the same time, there’s been an increase in the levels seen from single women who own properties valued at between £250,000 and £549,000, which has risen markedly from 43% of cases in 2019 to 56% in 2024.
Plan preferences and marital status
55% of single women preferred drawdown plans over lumpsum variants, a figure which again has remained unchanged year-on-year. This was in stark contrast to single male applicants, who preferred lumpsum plans (52% in 2024, though this represents a drop from the 60% seen in 2023).
Among single women, 36% of applicants were divorced (up from 32% in 2023), while the 38% who were widowed in 2024 represents a 6% decrease from the previous year. One in five (20%) of single women were unmarried in 2024, up from 18% in 2023. This compared with 27% of single male applicants being divorced (up from 22% in 2023), 36% being unmarried (up 6% annually) and 27% being widowed (down 8% from 2023).
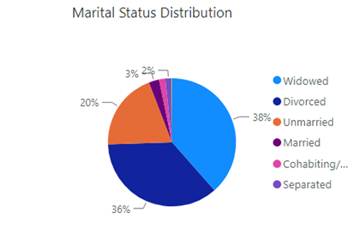
2024 marital status breakdown for new single female lifetime mortgage customers
How has this changed over time?
Single female applicants have been incredibly consistent in their preference of lumpsum plans, which has accounted for 53-57% of business among this demographic at all data points since 2019. This compares with single men, who have similarly preferred lumpsum plans – however, this has declined from a highpoint of a 67% proportion in 2021, to 52% in 2024, demonstrating increasing appetite for drawdown lifetime mortgages among this demographic.
In terms of marital status, the proportion of single women taking out equity release who are widowed has reduced consistently from a 46% highpoint in 2019 to the 38% seen in 2024. Meanwhile the proportion who are widowed are sitting at the highest point it ever has across all monitored data points.
Single men, meanwhile, have also seen reductions in the proportion of divorced applicants, falling from a high point of 30% in 2021, 22% in 2023, before rising to 27% last year. Widowed single men decreased markedly in 2024, falling from the consistent 34-35% seen across all other data points, to 30% last year. Additionally, from the 24% seen in 2021, the level of single men who are unmarried has since risen to 32% in 2024.
Loan usage
Single women are more likely than men to use funds for home improvements (26% vs 22% in 2024), and less likely to use released funds for debt and mortgage repayment (22% vs 24%). Women are also less likely than men to release funds for a car purchase (7% vs 10%), but more likely to gift to family friends (9% of women, while gifting wasn’t in men’s top five reasons). Holidays remain constant across both genders, at one in ten (10%).
Loan usage has remained fairly constant over time, and looking over historical data has shown that this particular demographic has consistently had the same top five reasons, with marginal shifts in activity levels (usually confined to a percentage or two, rather than any seismic shifts).
Conclusion
The latest findings continue to demonstrate the differing demographic trends (and by extension differing needs) between single life male and female customers in the later life lending space. This reinforces the need to not only have a diverse range of products suitable for a wide range of circumstances, but also of the need to have holistic and adaptable customer service throughout the lifetime mortgage journey post-completion to ensure continued best outcomes for consumers, regardless of their personal circumstances.
With disparities in earnings among those approaching retirement, as well as the vast differences in retirement provision and savings and rising levels of divorce among over-50s, property will likely only continue to become an increasingly important part of women’s financial planning in later life.
With this year’s theme of International Women’s Day focusing on the need to Accelerate Action, and emphasising the importance of taking swift and decisive steps to achieve gender equality, property wealth has the potential to offer another avenue for single women to achieve their financial goals in later life.


